Introducing: Gantt View
Do you look for a more convenient way to track your task durations and milestones clearly?
Do you want to be able to easily identify potential bottlenecks or delays in our project?
No worries. Gantt chart View is a powerful new feature in Plaky that will give you a detailed view of your project tasks on a timeline.
It will help you monitor the progress of your tasks, their duration and overall project completion in real-time.
What is Gantt Chart View
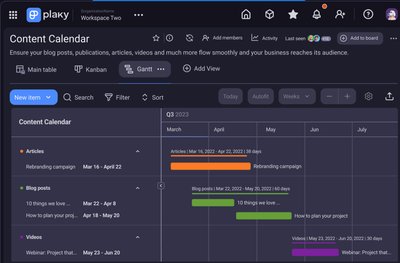
A Gantt chart view is a visual project management tool that displays tasks and activities along a timeline.
It shows the start and end dates, durations, and milestones for each task, represented by bars whose lengths correspond to task durations.
The benefits of Gantt view
Visual planning
Provides a clear visual representation of the project schedule, making it easy to see scheduled tasks, durations and deadlines.
Progress tracking
Enables real-time tracking of task and project progress, ensuring timely completion and facilitating adjustments as needed.
Milestone identification
Clearly marks key project milestones, helping to keep the project on track and celebrate achievements.
Flexibility
Allows for dynamic adjustments to the schedule, accommodating changes and rescheduling tasks easily.
Comprehensive overview
Offers a consolidated view of multiple projects, making it easier to manage complex initiatives and portfolios.
Key use cases for Gantt Chart Views
Software Development
Planning and tracking sprints, releases, and task dependencies in Agile or Waterfall development processes.
Marketing Campaigns
Scheduling and monitoring activities for comprehensive marketing plans, including content creation, promotions, and launch dates.
Product Launches
Organizing the steps and timelines for bringing a new product to market, from development to marketing and sales.
Research Projects
Structuring research phases, tasks, and deadlines, ensuring timely completion of studies and experiments.
Event Planning
Coordinating tasks, deadlines, and resources for organizing conferences, weddings, or corporate events.
Construction Projects
Managing timelines, dependencies, and milestones for building projects, ensuring all phases are completed on schedule.
Setting up the Gantt view
The Gantt view is made up of your already existing board which should be populated with groups, tasks, and essential fields: Date and Timeline.
To access and create the Gantt view, select the cog icon in the sub-menu of your board and choose “Create new view”
A pop-up menu will appear and from there you can choose the view type. Select “Gantt” as your board type, name your board view, and you’re all set!
A Gantt board view will be displayed and divided into two sections.
The left sidebar contains all of the items with dates.
The right sidebar displays tasks as horizontal bars along a timeline to give users a clear visual on task duration.

Customizing Gantt settings
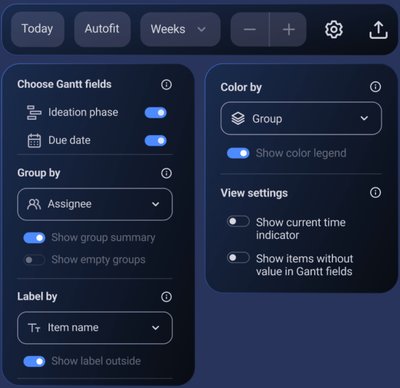
To adjust view settings and customize the Gantt view according to your specific project requirements, simply click on the settings icon located in the top right corner of the interface.
Here you’ll be able to set up Gantt fields, define grouping, coloring, label criteria for items, and choose additional view settings to better fit your project process.
For example, you can toggle the on and off button to choose among all date and timeline fields to be included in the Gantt chart so that all relevant data is accurately represented.
The “Group by” setting allows you to choose your preferred grouping criteria from a dropdown menu, including options such as: item group, status field, person, tag field, or none.
Here you can also toggle the radio button to choose whether you want to show a group summary or empty fields.
Users also have the option to tailor task labels using different criteria like person, status, date, or timeline.
For instance, selecting the “person” field allows you to identify who in your team is responsible for each task along the timeline.
Also, you can customize the coloring criteria for tasks and choose to apply the color of any status field or none. If none is selected, tasks will be displayed in gray.
If preferred, users also have the option to show a time indicator that displays as a vertical line in the chart to highlight the current date/time if the time period is set to “Day”.

Additional Gantt functionalities
Just when you thought it couldn’t get any better, we have even more ways to enhance your Gantt view experience.
You have a variety of functions provided to customize and manage your tasks!
For instance, users can drag and drop items by moving them along the timeline to adjust schedules.
There is also the “Autofit” button that adjusts the timelines to fit into a single view, and the “Now” button narrows the timeline down to the current day.
Users also have the option to “zoom in and out” in the timeline for a detailed look at tasks. Tasks can also be filtered, sorted, exported, and can be looked up in a search bar for convenience.
Now you have a nice new, and user-friendly tool in your belt that you can tackle your project with!
You have a useful visual representation of your tasks that’s fully customizable and great for better planning, and tracking progress!

FAQ
How can I adjust the timeline or date range displayed in the Gantt chart to focus on specific periods?
You can adjust them by using zoom or scroll features, allowing you to focus on specific periods such as weeks, months, or quarters
Can I customize the Gantt chart to show specific task details or dependencies?
Yes, you can customize it to show specific task details or dependencies by selecting which columns to display, including task names, start and end dates, durations, and other information.
Can I export or print the Gantt chart for offline use or sharing with stakeholders who may not have access to Plaky?
Absolutely, you can export the Gantt chart for offline use or sharing with stakeholders. You can export it as a CSV file, allowing stakeholders to import it into other project management platforms, or as an Excel file for easy sharing and analysis.