Published: March 28, 2025
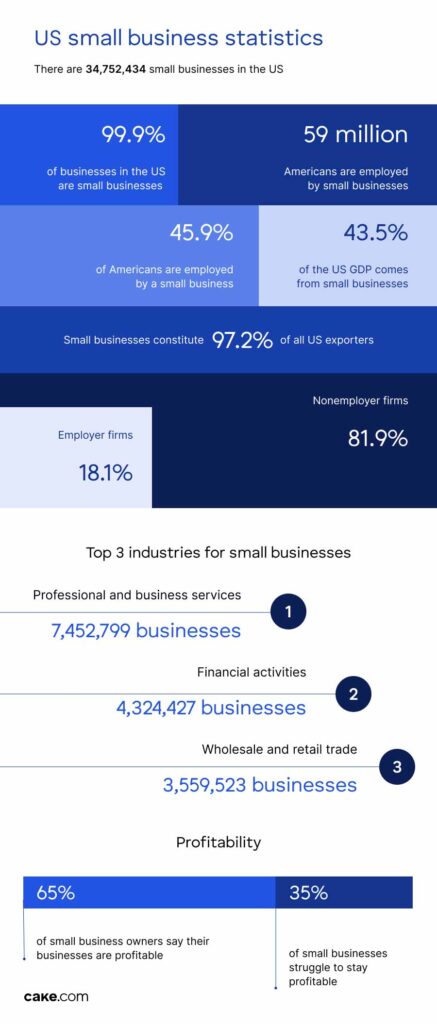
 Small businesses form the backbone of the US economy — they are responsible for 43.5% of the country’s GDP, 45.9% of private sector employment, and 97.2% of all exports.
By securing jobs for 59 million Americans, not only do small businesses drive economic growth, but they foster innovation and create new opportunities.
Despite the ever-present challenges they face, small businesses continue to show remarkable resilience.
Whether you’re thinking of starting your own business, or you’re simply curious to understand the current landscape of small businesses in the US — you’re in the right place, as we’ll cover:
- Success and failure statistics,
- Common challenges,
- Owner demographic breakdowns,
- Earnings and revenue statistics,
- Cybersecurity trends, and much more.
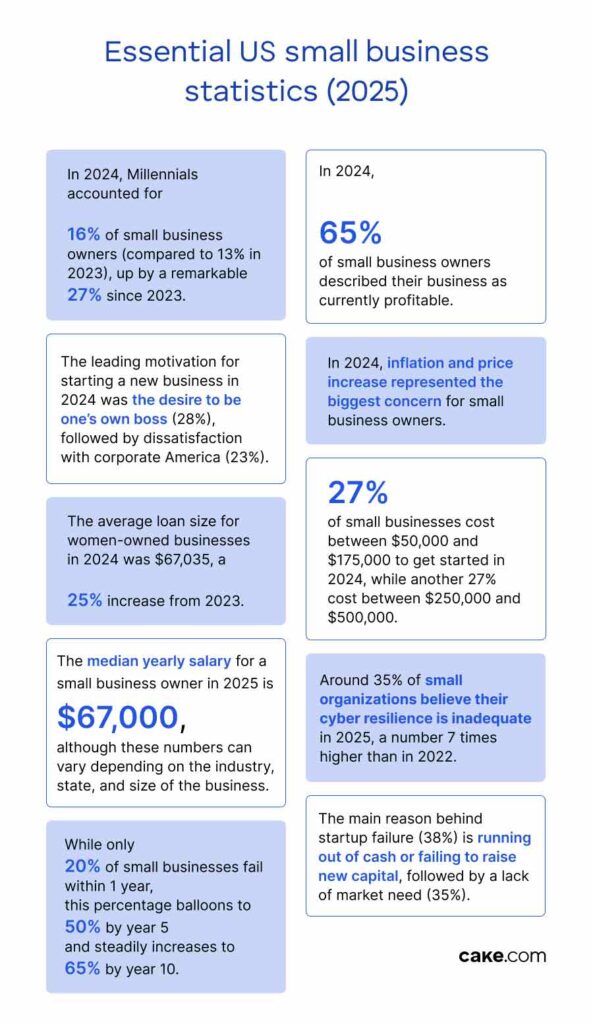
- In 2024, Millennials accounted for 16% of small business owners (compared to 13% in 2023), up by a remarkable 27% since 2023.
- In 2024, 65% of small business owners described their business as currently profitable.
- In 2024, inflation and price increase represented the biggest concern for small business owners.
- The leading motivation for starting a new business in 2024 was the desire to be one’s own boss (28%), followed by dissatisfaction with corporate America (23%).
- 27% of small businesses cost between $50,000 and $175,000 to get started in 2024, while another 27% cost between $250,000 and $500,000.
- The average loan size for women-owned businesses in 2024 was $67,035, a 25% increase from 2023.
- The median yearly salary for a small business owner in 2025 is $67,000, although these numbers can vary depending on the industry, state, and size of the business.
- Around 35% of small organizations believe their cyber resilience is inadequate in 2025, a number 7 times higher than in 2022.
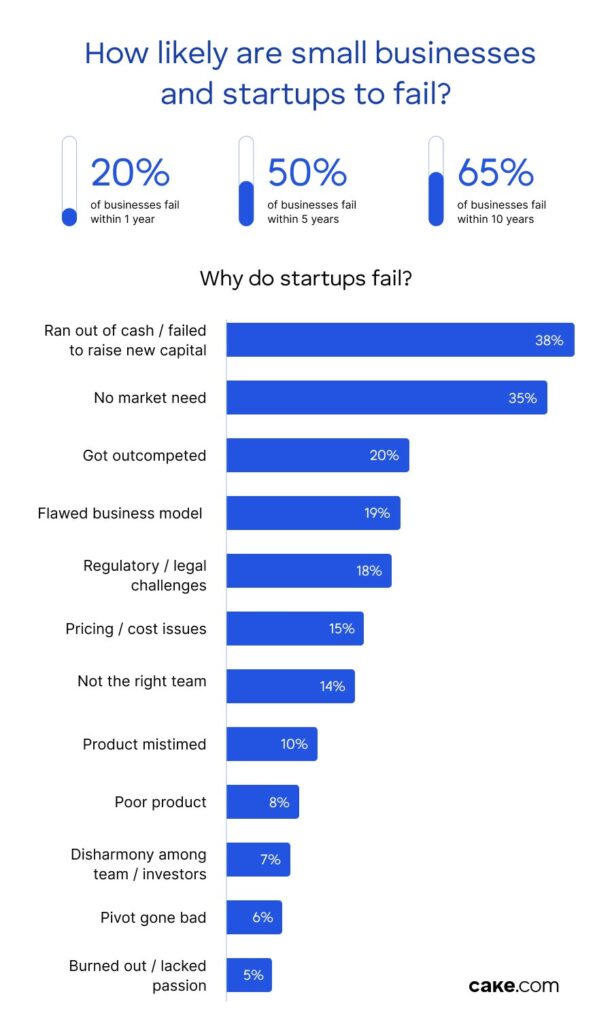
- While only 20% of small businesses fail within 1 year, this percentage balloons to 50% by year 5 and steadily increases to 65% by year 10.
- The main reason behind startup failure (38%) is running out of cash or failing to raise new capital, followed by a lack of market need (35%).
What is a small business?
The US Small Business Administration Office of Advocacy defines a small business as “an independent business having fewer than 500 employees.”
According to the Office of Advocacy, any business that has anywhere between 0 and 499 employees is a small business, and all of these businesses collectively contribute to most of the statistics relevant to the US.
The Europeans also use the term SME (small and medium-sized enterprises) to collectively refer to all businesses with fewer than 250 employees — which serves as the closest analog to the American definition of small businesses.
The definitions get a bit more nuanced than this. For example, the US Small Business Administration uses different standards for classifying small businesses in different industries (a surface coal mining business with 1,250 employees is still counted as a small business).
However, the point we wanted to get across is that there are different definitions out there. So, for the purposes of this text, the term small business refers to all businesses with fewer than 500 employees.
Small businesses punch above their weight class
You would think that small businesses would have a small impact on the economy and a country’s GDP, but this couldn’t be farther from the truth.
When you hear statements like “small businesses are the backbone of the economy”, you should, indeed, take them quite literally.
Why, you might ask?
For starters, in the US, 99.9% of all businesses are small businesses. The latest 2024 statistics by the Office of Advocacy show that there are 34,752,434 small businesses in the US. Conversely, there are only 19,688 large businesses.
Also, small businesses create the most jobs. Between 1995 and 2023, small businesses were responsible for creating 20.2 million net new jobs or 61.1% of net jobs created in this period.
The 2024 Small Business Profile report by the Office of Advocacy shows that there are 6,274,916 small business owners and 58,951,278 small business workers.
Small businesses also constitute 97.2% of all US exporters.
Get 3 enterprise tools for the price of 1
Cut your costs in half while keeping productivity at full throttle. Get Clockify, Pumble, and Plaky at a 53% discount with the CAKE.com Productivity Bundle.

Further reading:
If you find these stats inspiring and you want more of that good stuff to lift your entrepreneurial spirits and boost your motivation, check out our compilation of small business quotes:
Most small businesses have zero employees
While small businesses do pull ahead of large businesses in some categories, they’re much more evenly matched — or even fall behind — in others.
For example, still sticking with the 2024 Office of Advocacy statistics, small businesses employ 59 million Americans, which accounts for 45.9% of private sector employment.
Moreover, small businesses are responsible for 39% of the private sector payroll and 43.5% of the country’s GDP.
Not to imply that these feats are insignificant, but they fall flat of the expectations you might have upon hearing that small businesses make up 99.9% of all businesses.
This seemingly inexplicable discrepancy in the proportion of small and large businesses and their impact on employment and payroll makes more sense when we take into account that 81.9% of small businesses are nonemployer firms.
In other words — 28,477,518 small businesses have no employees.
Therefore, only 18.1% of small businesses — or 6,274,916 businesses as stated in the July 2024 Office of Advocacy FAQ — constitute employer firms that have paid employees and can compete with large businesses in the realm of employment statistics.
This still leaves small businesses as 99.7% of all businesses with paid employees.
The number of small employer firms has increased gradually each year since 2011, whereas the number of nonemployer firms has increased by 84% since 1997.
Further breakdown of small businesses by the number of employees — for which the latest statistics come from the 2024 Small Business Profile by the Office of Advocacy — shows that approximately 16.31% of small businesses have between 1 and 19 employees.
Demographic statistics on small business owners
Courtesy of the 2024 Small Business Profile report, we also know what the demographics of small business ownership and workers are.
| Demographic | Small business ownership | Small business workers |
|---|---|---|
| Women | 44.1% | 47.1% |
| Veterans | 5.5% | 4.4% |
| Hispanics | 5.5% | 17.8% |
| Racial minorities | 22.1% | 31% |
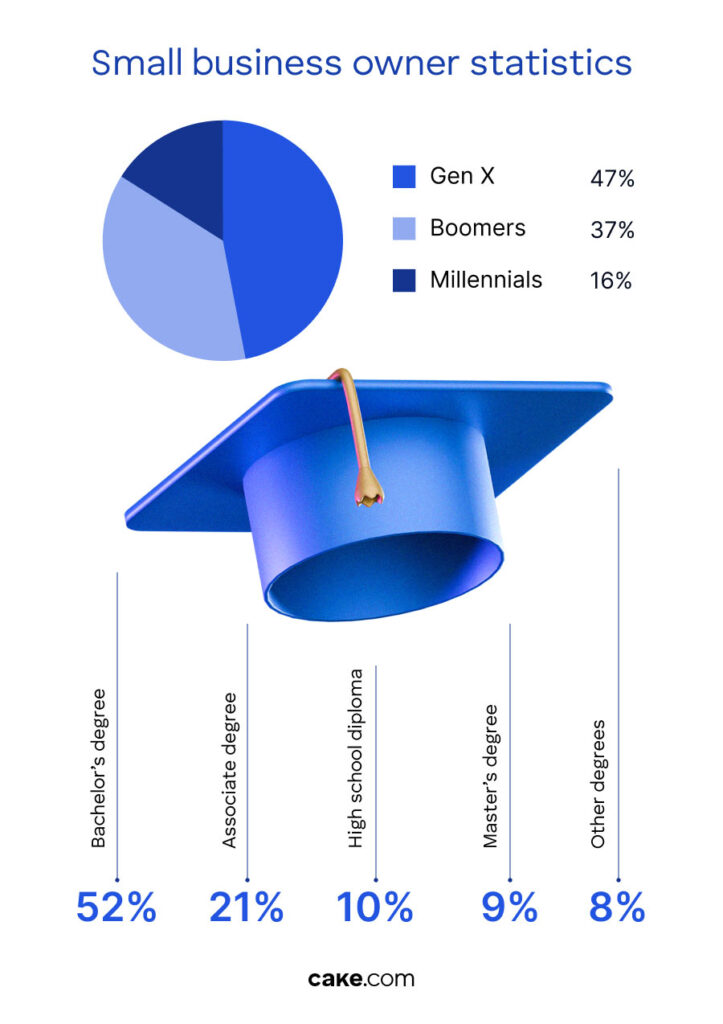
More information regarding the generation gap between small business owners can be gleaned from Guidant Financial’s 2024 Small Business Trends report, which reveals that, despite Gen X and Boomers continuing to lead the way in small business ownership, Millennials are on the rise.
| Age range | Percentage of business owners |
|---|---|
| Gen X | 47% |
| Boomers | 37% |
| Millennials | 16% |
In fact, the percentage of Millennial business owners, as shown in the 2024 Small Business Trends report, has increased by a remarkable 27% since 2023, highlighting Millenials’ growing influence and presence in the world of small business.
Gen Z business owners were excluded from the both 2023 and 2024 report, but in the 2022 report, they were shown to have been the owners of 0.5% of businesses.
Further reading:
If you’re interested to learn more specifics about Gen Z, take a look at the following article:
Demographic statistics on nonemployer businesses
In December 2024, the United States Census Bureau published the Nonemployer Statistics by Demographics (NES-D) report. It provides the latest data for nonemployer businesses for the year 2022.
This dataset provides subnational economic data for businesses without paid employees that are subject to federal income tax and have receipts of $1,000 or more.
In addition, the Nonemployer Statistics by Demographics series offers insights into the demographic characteristics of nonemployer businesses. The most recent NES-D data covers the year 2021 and was released in August 2024.
You can see the statistics in the table below:
| Demographic | Percentage of nonemployer businesses owned | Receipt size |
|---|---|---|
| Women | 42.1% | $365.2 billion |
| Hispanic | 16.6% | $193.9 billion |
| Veteran | 4.6% | $61.7 billion |
| Asian | 8.6% | $131 billion |
| Black / African American | 14.5% | $109.8 billion |
| American Indian / Alaska Native | 1.2% | $12.5 billion |
| Native Hawaiian / other Pacific Islanders | 0.3% | $3.4 billion |
Further reading:
For more (fun) facts about business owners, check out our compilation of statistics on entrepreneurs:
What drives people to start small businesses
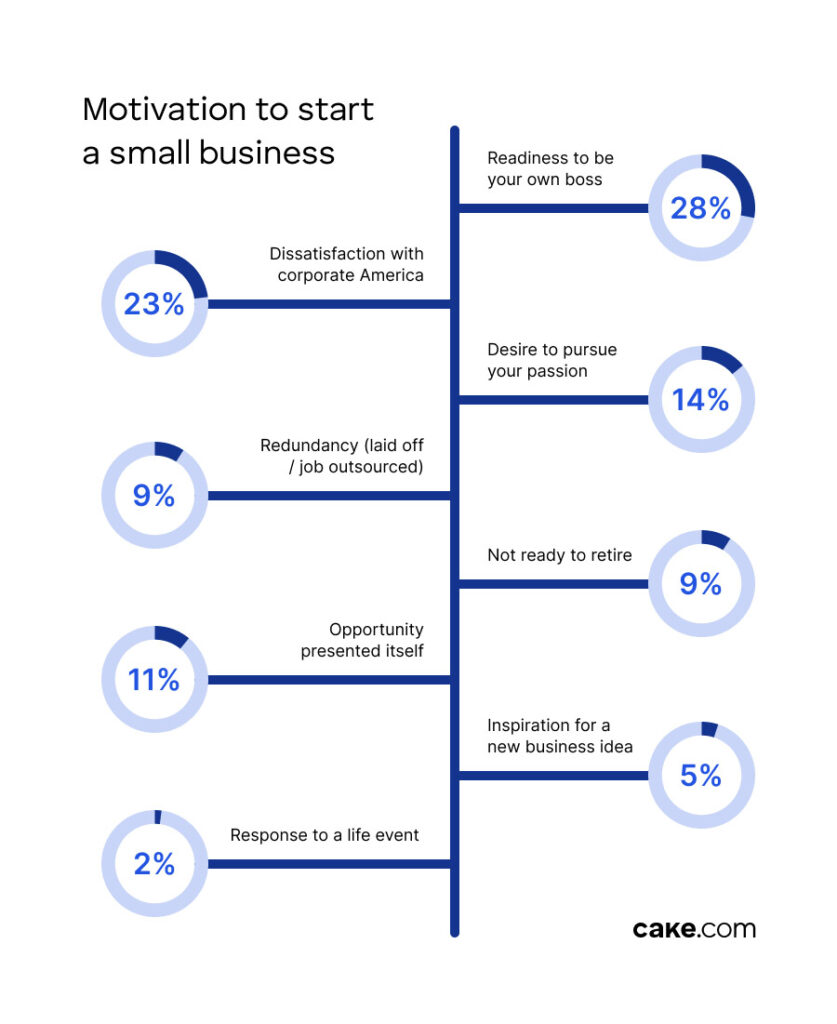
Guidant Financial’s 2024 Small Business Trends report provides insight into the motivations behind the emergence of small businesses — in other words, why business owners choose to become business owners.
The leading motivation is the desire to be one’s own boss, but it’s far from the only motivation, as shown in the table below.
| Motivation to start a small business | Percentage of respondents |
|---|---|
| Readiness to be your own boss | 28% |
| Dissatisfaction with corporate America | 23% |
| Desire to pursue your passion | 14% |
| Opportunity presented itself | 11% |
| Redundancy (laid off / job outsourced) | 9% |
| Not ready to retire | 9% |
| Inspiration for a new business idea | 5% |
| Response to a life event | 2% |
Why don’t all people start small businesses?
In addition to the general concerns over starting a small business, such as funding or riskiness, here is some more recent data regarding small business confidence.
According to the latest National Federation of Independent Business (NFIB) survey conducted in March 2025, small business confidence dropped for the third consecutive month.
Namely, the NFIB Small Business Optimism Index fell by 2.1 points to 100.7 in February 2025, which is 4.4 points below its most recent peak of 105.1 in December 2024.
As stated in the report, the top problem is labor quality, specifically the difficulty in finding skilled workers, with inflation coming right after it.
But despite the decline in optimism, the index still remains above its 51-year average of 98, indicating resilience among small business owners.
How much does it cost to start a small business?
While we understand the why behind people starting their small businesses, the how remains just as big a factor to consider.
First and foremost, the cost of starting a small business is significant.
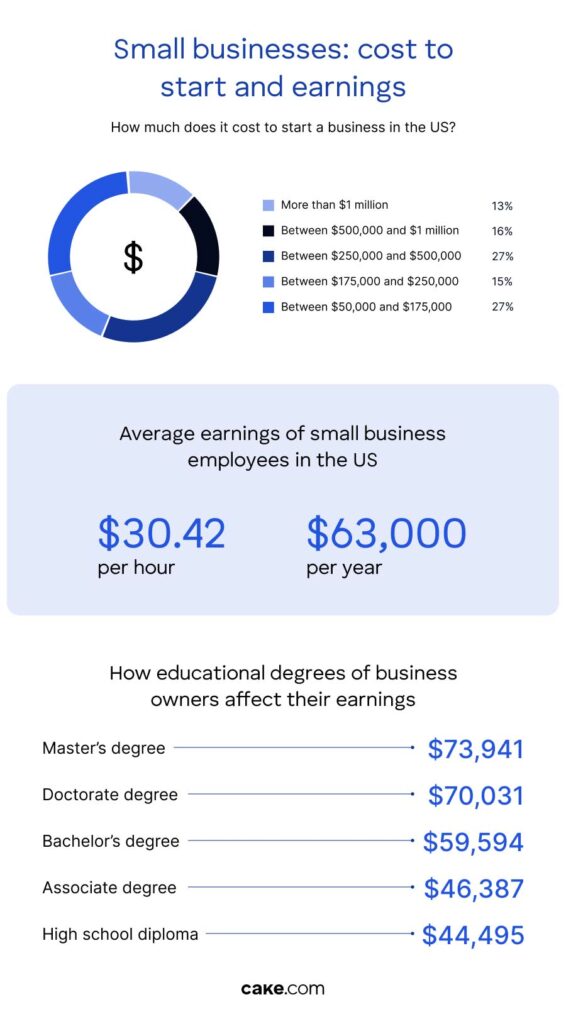
According to Guidant Financial’s 2024 survey, the cost to start a business ranges from around $50,000 to more than $1 million.
| Cost to start a small business | Percentage of businesses |
|---|---|
| Between $50,000 and $175,000 | 27% |
| Between $175,000 and $250,000 | 15% |
| Between $250,000 and $500,000 | 27% |
| Between $500,000 and $1 million | 16% |
| More than $1 million | 13% |
To gather the capital needed to do this, prospective small business owners overwhelmingly (52%) turn to 401(k) business financing, also known as Rollovers for Business Startups (ROBS) — withdrawing money from their retirement accounts.
Aside from this, the only 2 financing options that enjoy a double-digit share of the financing source pie are cash (19%) and Small Business Administration (SBA) loans (12%).
Biz2Credit’s Annual Women-Owned Business Study 2025 also found that the average loan size for women-owned businesses in 2024 was $67,035, a25% increase from 2023. In comparison, men-owned businesses received an average loan of $80,140, a7% increase from the previous year.
These figures indicate a positive trend in funding for women-owned businesses in recent years. However, the difference in loan amounts compared to male-owned businesses is still noticeable.
Get 3 enterprise tools for the price of 1
Cut your costs in half while keeping productivity at full throttle. Get Clockify, Pumble, and Plaky at a 53% discount with the CAKE.com Productivity Bundle.
Further reading:
If you’re interested to learn more about the experiences of women in business, check out the following interview with Anita Anthonj:
How many new businesses are being started?
According to the US Census Bureau data on business applications by state, there was a decrease in the number of businesses started in January 2025 compared to the previous months.
Here’s a table showcasing the total number of business applications in the US over the past months:
| Month | Number of applications |
|---|---|
| January 2025 | 392,496 |
| December 2024 | 456,309 |
| November 2024 | 447,184 |
| October 2024 | 426,474 |
| September 2024 | 427,131 |
| August 2024 | 432,604 |
The data in the table shows a declining trend in business applications, with a notable drop in January 2025.
For comparison, over the past 5 years, April 2020 — just one month after the first coronavirus restrictions — had the fewest business applications at 235,695.
In contrast, July 2020 saw the peak, with applications surging to 546,415.
Revenue statistics for small businesses
We should preface this segment by saying that the statistics shown here are more useful for curiosity-satiating purposes than practical application.
For example, the median yearly salary for a small business owner in 2025, according to Payscale, is $67,000.
The latest official data available comes from the US Census in their 2019 Statistics of US Business Survey (the latest of its kind, released in 2022), which reports a median salary of $55,858 for self-employed individuals.
Similarly, the US Chamber of Commerce states that small businesses pay employees an average of $30.42 per hour which amounts to $63,000 a year.
In either case, these median salaries include small businesses of all sizes, across all industries, and in all countries.
For example, business owners in Washington make $120,339 yearly, while Mississippi has the lowest business owner salary of $40,281 — more than in any other state, according to Zippia.
While not strictly focused on small businesses, when we examine the 2023 annual wage difference between the highest-paid occupational group (management occupations at $137,750) and the lowest-paid group (food preparation and serving-related occupations at $34,490), we can conclude that the difference between the highest- and lowest-paid occupational groups can be as much as approximately 4 times.
Average annual revenue for women-owned businesses increased by 13.1%, from $451,443 in 2023 to $519,886 in 2024, according to the 2025 Biz2Credit study, narrowing the revenue gap to 30% compared to men-owned businesses (down from a 34% gap in 2023).
As you can imagine, the variability of individual units within such a sample set is large and diverse. Therefore, this is not necessarily indicative of what you should expect to earn as a small business owner in any particular industry.
Educational backgrounds and earnings
Large sample size data like this is great for comparing more abstract statistics, like the ones from the Business Owner Education Requirements report by Zippia. This report includes insights into such things as which educational degrees business owners have and how this affects their wage.
| Educational degree level | Percentage of business owners with this education |
|---|---|
| Bachelor’s degree | 52% |
| Associate degree | 21% |
| High school diploma | 10% |
| Master’s degree | 9% |
| Other degrees | 8% |
We can only assume that the table above does not include doctorate degrees because there weren’t enough PhD business owners to warrant being a separate group and that they were lumped together with other degrees.
This is, of course, an assumption, but it’s an educated assumption given the same study includes doctorate degrees when showing a breakdown of how much business owners with different educational backgrounds earn.
Spoiler alert — PhD business owners actually make less than those with Master’s Degrees, according to the above-mentioned Zippia report.
| Education degree level | Median annual income |
|---|---|
| Bachelor’s degree | $59,594 |
| Associate degree | $46,387 |
| High school diploma | $44,495 |
| Master’s degree | $73,941 |
| Doctorate degree | $70,031 |
Job demand statistics
Employment trends have remained relatively stable over the past year, according to The Employment Situation report by the Bureau of Labor Statistics for February 2025.
The report shows that the unemployment rate for February 2025 was at 4.1%. Just for reference, the unemployment rate has remained between 4% and 4.2% since May 2024.
The same report states that employment increased in health care, finance, transportation, and social services, while federal government employment declined by 10,000 in February 2025.
Here’s the table showing a monthly job increase in the above-mentioned industries:
| Industry | Average monthly job increases in 2025 |
|---|---|
| Health care | +52,000 |
| Financial activities | +21,000 |
| Transportation and warehousing | +18,000 |
| Social assistance | +11,000 |
The top 3 industries for small businesses, according to the US Chamber of Commerce, include:
- Professional and business services with 7,452,799 businesses,
- Financial activities with 4,324,427 businesses, and
- Wholesale and retail trade with 3,559,523 businesses.
How likely are small businesses and startups to fail?
Failure statistics of any kind tend to paint a bleak picture of whatever it is they’re describing, so we want to preface them by sharing some optimistic statistics that will serve as additional context.
Namely, Guidant Financial’s 2024 report shows that 65% of small business owners describe their businesses as currently profitable. This majority indicates a positive trend.
However, 35% of businesses are struggling to stay profitable, which is still a high number.
It should also be noted that the surveyed respondents were mainly from newly established businesses, and the numbers show that it takes 2 to 3 years to reach profitability.
When do small businesses fail?
According to data on the survival of private sector establishments by opening year, we can see that approximately 20% of new businesses fail within a year.
By year 5, the failure rate of businesses is about 50%. In other words, if you opened a business today, the statistical probability of it staying open after 5 years is close to a coin toss.
At 10 years old, the mortality rate of small businesses hovers around 65%.
On the bright side, while some businesses fail, this also creates opportunities for new businesses to enter the market. The constant cycle of new businesses opening and closing can lead to innovation and fresh ideas.
According to the same report, it can be said that the larger the business size, typically the better its survival rate. This may be due to their better handling economic challenges.
Growth is often a key indicator of potential success, while stagnation or contraction can lead to higher risks of business failure, possibly due to financial strains.
It should be noted that this data operates only using the number of businesses opened and closed, without taking into account why businesses closed. Therefore, cases where a small business owner decides to retire and closes their business after years of success are still counted as failures.
Why do startups fail?
There is no specific research on small business failure, however, we can turn to information reported by CB Insights in their research on startup failures.
There are 12 key reasons behind startup failure:
| Reason for startup failure | Percentage of startups |
|---|---|
| “Ran out of cash / failed to raise new capital” | 38% |
| “No market need” | 35% |
| “Got outcompeted” | 20% |
| “Flawed business model” | 19% |
| “Regulatory/legal challenges” | 18% |
| “Pricing/cost issues“ | 15% |
| “Not the right team” | 14% |
| “Product mistimed” | 10% |
| “Poor product” | 8% |
| “Disharmony among team/investors” | 7% |
| “Pivot gone bad” | 6% |
| “Burned out / lacked passion” | 5% |
Further reading:
To learn more about burnout at work, check out the following blog:
The biggest small business challenges
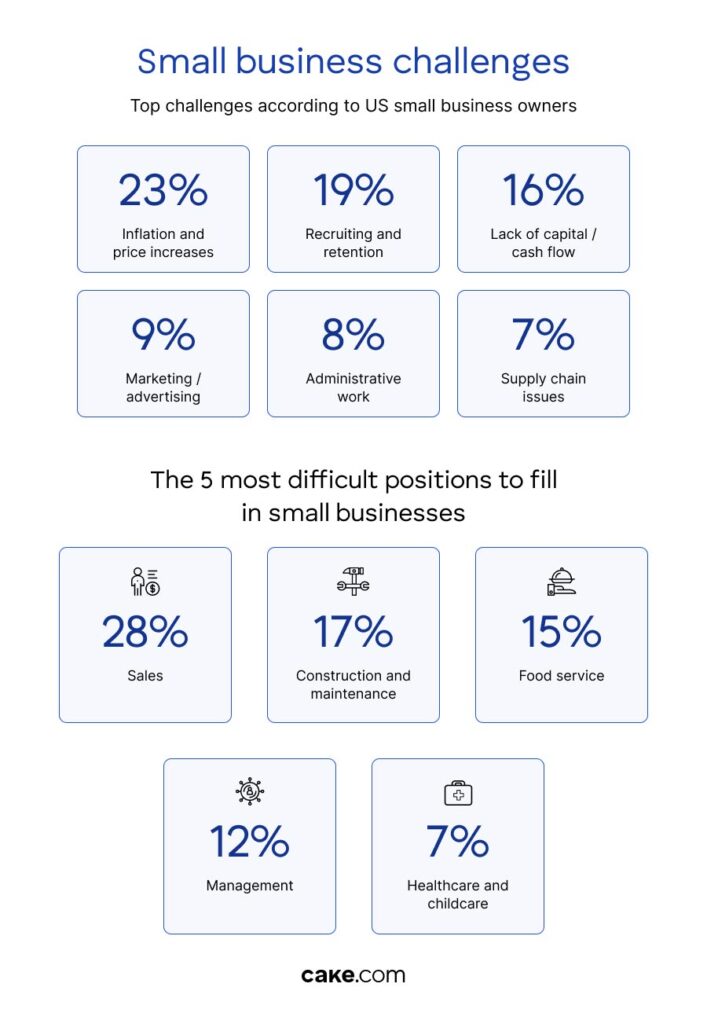
According to the 2024 report by Guidant Financial, inflation and price increase come to the forefront as the biggest concern for small business owners.
Here are other common challenges small businesses face:
| Top challenges according to small business owners | Percentage |
|---|---|
| “Inflation / price increases” | 23% |
| “Recruiting / retention” | 19% |
| “Lack of capital / cash flow” | 16% |
| “Marketing / advertising” | 9% |
| “Administrative work” | 8% |
| “Supply chain issues” | 7% |
Though recruitment and retention challenges rank as one of the top small business challenges, it’s still significantly lower than the previous year. This is encouraging data for all business owners.
| How difficult was hiring this year? | Percentage of business owners |
|---|---|
| Very easy | 3% |
| Somewhat easy | 8% |
| The same as compared to past years | 25% |
| Somewhat difficult | 22% |
| Very difficult | 11% |
At the same time, in 2024, the desire to increase staff is shown to be the highest priority plan for most business owners (24%).
As for reasons behind the difficulty in hiring, the respondents cited the following:
| Cause of difficulty in hiring | Percentage |
|---|---|
| “Candidates don’t have necessary work experience” | 20% |
| “Low number of applicants / low interest” | 19% |
| “Candidates don’t have necessary soft skills” | 15% |
| “Competition from other employers” | 14% |
| “Candidates don’t have necessary technical skills” | 13% |
| “Salaries and benefits are not competitive” | 11% |
Nor are all positions equally difficult to fill — the 5 most difficult positions to fill in small businesses are:
- Sales — 28%
- Construction and maintenance — 17%
- Food service — 15%
- Management — 12%
- Healthcare and childcare — 7%
Get 3 enterprise tools for the price of 1
Cut your costs in half while keeping productivity at full throttle. Get Clockify, Pumble, and Plaky at a 53% discount with the CAKE.com Productivity Bundle.
Small business owner happiness statistics
Despite the economic challenges small businesses face in these times, the overwhelming majority of small business owners report being happy (73%).
Namely, as part of the 2024 Guidant Financial survey, small business owners were asked to rate their happiness on a 5-point scale ranging from very unhappy to very happy. These are the results:
| Happiness level | Percentage |
|---|---|
| Very happy | 36% |
| Somewhat happy | 37% |
| Neutral | 15% |
| Somewhat unhappy | 8% |
| Very unhappy | 4% |
When asked to respond to whether they expect to survive today’s economy, respondents said:
- Yes — 77%
- No — 5%
- Unsure — 18%
Guidant Financial also dug deeper into the confidence levels of small business owners in the current political climate. Here are the results:
| Confidence level in the current political climate | Percentage of business owners |
|---|---|
| Very confident | 5% |
| Somewhat confident | 28% |
| Neutral | 23% |
| Somewhat unconfident | 32% |
| Very unconfident | 14% |
Small business mobile statistics
According to Google research on consumer trends, at any given moment, 84% of Americans are shopping for something. In almost 25% of cases, shoppers refer to their smartphones when they want to buy something.
The same data also indicates that 9 out of 10 shoppers don’t start out with preconceived notions of which brand they want to buy from.
This would suggest that small businesses should be more than capable of competing for customers with big brands online.
That being said, there are some roadblocks you should be aware of.
For starters, smartphone users are more likely to buy from companies whose mobile sites or apps provide easy-to-find information.
They want their shopping and billing information to autofill if they’re buying for a retailer they’ve used previously in 61% of cases. And, they’re quick to bail if the mobile experience isn’t smooth or the page takes too long to load.
Negative experiences on mobile such as these reduce the chances of online shoppers purchasing for you in the future by 62%.
Though the global conversion rate of online shoppers in 2024 was just over 2%, there may be some practices that could help you increase the number of purchases and let small businesses compete for customers with big brands online.
The Forbes article on Mobile Marketing Trends You Can’t Afford To Ignore suggests the following practices:
- Creating mobile-friendly content,
- Focusing on fast page-loading speed and intuitive navigation,
- Using AI for personalized mobile marketing,
- Creating location-based targeted promotions,
- Offering various mobile payment options (e.g. PayPal, Apple Pay, Google Wallet), or selling directly through social media platforms, and
- Creating mobile-optimized engaging video content.
Further reading:
Looking for tips on how to implement AI without triggering burnout? Check out the following blog post:
Statistics on small business websites
Research by Zippia on how many businesses have websites shows 99% of consumers find local businesses through the Internet. Moreover, 81% of shoppers first look up information about the business online before they make a purchase, in most cases by reading online reviews (55%) or looking up the website of the business in question (47%).
Additionally, 44% of B2B buyers will immediately give up on using a small business if their website has no contact information.
How tragic is it then that 27% of small businesses don’t have a website?
The impact of this statistic on small businesses is dampened somewhat by the fact that over 20% of small businesses without websites use social media instead.
For a complete breakdown of why small businesses don’t have websites, you can refer to this table.
| Reasons behind not having a website | Percentage of small businesses |
|---|---|
| They believe it’s not relevant to their industry | 27% |
| They cite the cost as being too large | 26% |
| They use social media instead | 21% |
| They lack the technical knowledge to operate and maintain a website | 15% |
In light of the second most common reason behind not having a website, it bears pointing out just what the cost of designing a website for a small business is.
| Cost brackets for designing and launching a small business website | Percentage of websites that cost this much |
|---|---|
| Between $5,000 and $6,000 | 13.5% |
| $4,000 | 10.8% |
| $3,000 | 16.2% |
| Between $2,000 and $2,500 | 24.3% |
| Between $1,000 and $1,500 | 35.1% |
Small business cyber security statistics
According to the Forbes article on Cybersecurity, only 14% of small businesses in the US are taking measures to protect themselves from cyber attacks.
Meanwhile, 43% of cyber attacks target small businesses. This means that the majority of small businesses are woefully unprepared to combat cyber attacks.
The most common means of cyber attacks against small businesses (57%) is phishing.
According to the most recent World Economic Forum’s Global Cybersecurity Outlook 2025 report, around 35% of small organizations believe their cyber resilience is inadequate. For reference, this number is 7 times higher than it was in 2022.
The conclusion is that smaller businesses are more exposed to risk and struggling to ensure cyber resilience in 2025. The Cybersecurity report lists several factors that might be the reason, such as:
- Limited access to cybersecurity infrastructure,
- Lack of financial resources,
- Lack of governance frameworks related to cybersecurity, and
- Difficulties in hiring skilled employees.
Further reading:
Learn more about how businesses can strengthen security measures and enhance their resilience in the IT sector:
Despite constant challenges, small businesses remain resilient in 2025
While the economic situation often seems uncertain for small businesses, they still persevere — and that with a smile on the faces of business owners running them.
Despite current economic and political fluctuations, the majority of small businesses remain profitable.
Based on the overall statistics, it seems that one of the key factors for small business success lies in the ability to adapt in order to remain profitable and relevant in the market, e.g. by:
- Growing an online presence,
- Embracing technology and adopting the right business tools, and
- Effectively addressing security challenges.