We’re excited to announce that our task and project management tool Plaky has just released a new visual layout for all users — Chart view!
Now, you can have even more control over how you organize and visually portray your boards, with an extra sprinkling of data analytics and reporting.
What is Chart view?
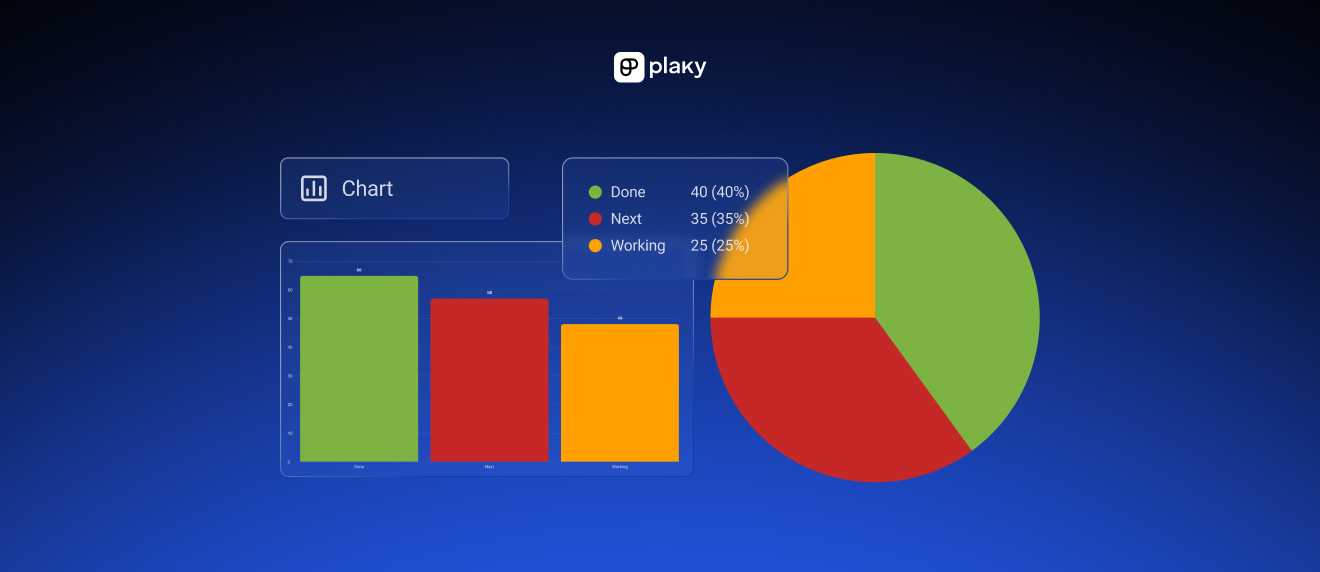
Chart view is Plaky’s new view layout for visualizing your boards as either pie charts or bar charts.
With it, you can get an interactive and dynamic breakdown of your tasks, filtered and sorted according to whatever criteria you want.
Why use Chart view?
By breaking down and visually displaying board data, Chart view enables you to make data-driven decisions.
You can use it to get valuable insights into different aspects of your workflow and progress.
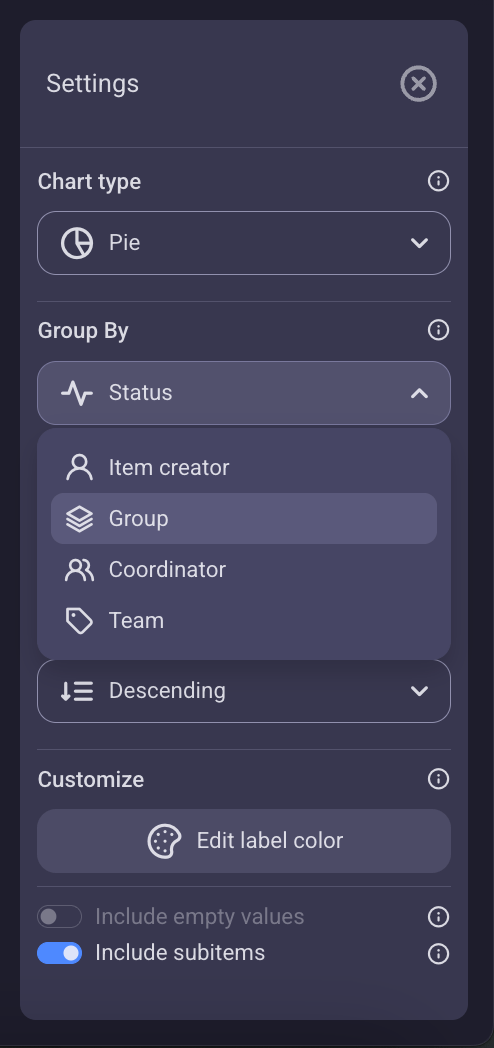
If you group the tasks by:
- Status — you can immediately see how much progress the team has made based on the percentages of tasks that are labeled as To do, Doing, Done, or any other custom status.
- Person — you can see how many tasks are assigned to each team member, letting you avoid bottlenecks and overburdening employees.
- Tags — you can see the breakdown of all tasks according to your custom tags, such as the tags for departments showing you which teams need extra hiring, or the tags for illustration types showing you what kinds of illustrations your designers are spending the most time on.
- Board groups — you can see how the workload is divided between custom groups, such as when using Current Sprint and Backlog groups to see how well the current Sprint is coming along.
How granular can it get?
Now, you might be thinking: “I’ve got years of finished tasks on my boards, not to mention a bunch of upcoming ones. Won’t they mess with the data?”
Worry not — our devs have thought of everything!
Not only can you switch between pie chart and bar chart on the fly, but you can also use filters to determine which tasks get used for the chart. You can choose to include only tasks that were created today, this week, this month, and so on. In addition to filters, there are also toggles for subitems and tasks with empty values.
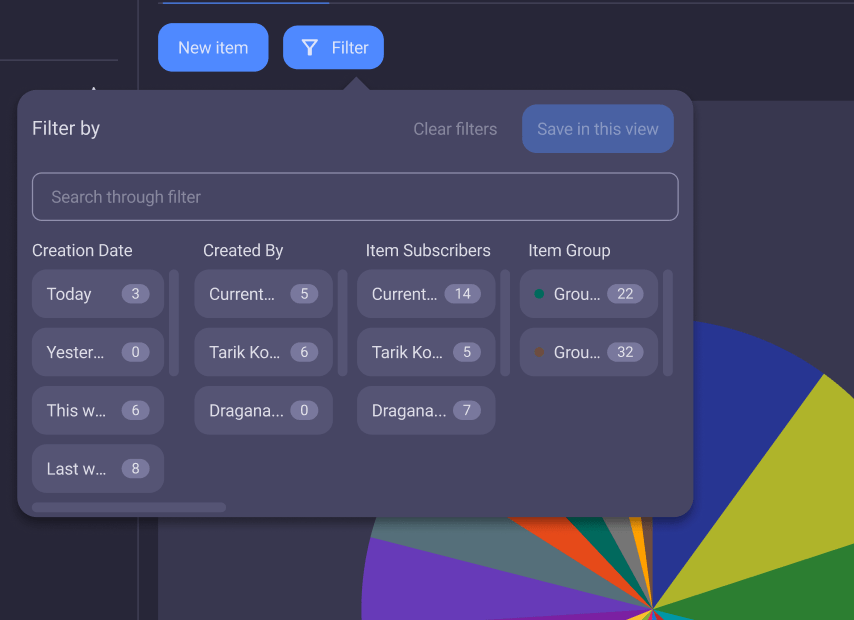
So, when it comes to chart data input, you can control all the fine details with granular precision.
How to set it up?
Setting up a Chart view is easy:
- Open your Board,
- Click on the gear icon next to your existing view (Table view, by default),
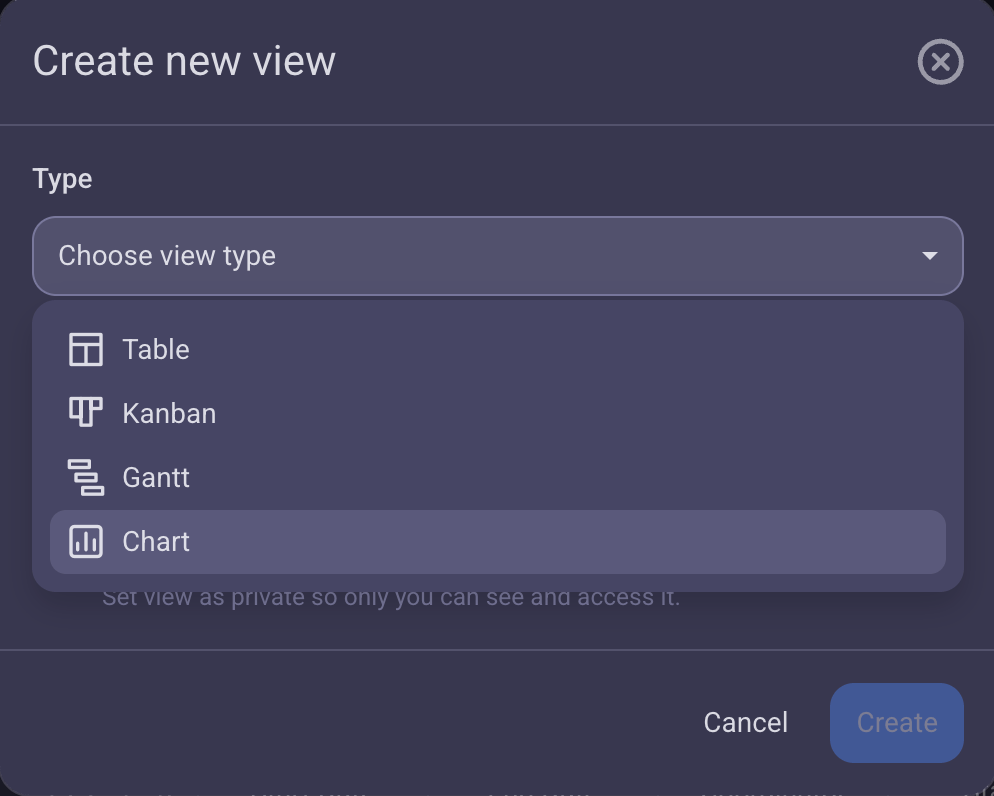
- Click on Create new view,
- Click on Choose view type,
- Select Chart from the dropdown menu,
- Name the view however you want, and
- Click on Create.
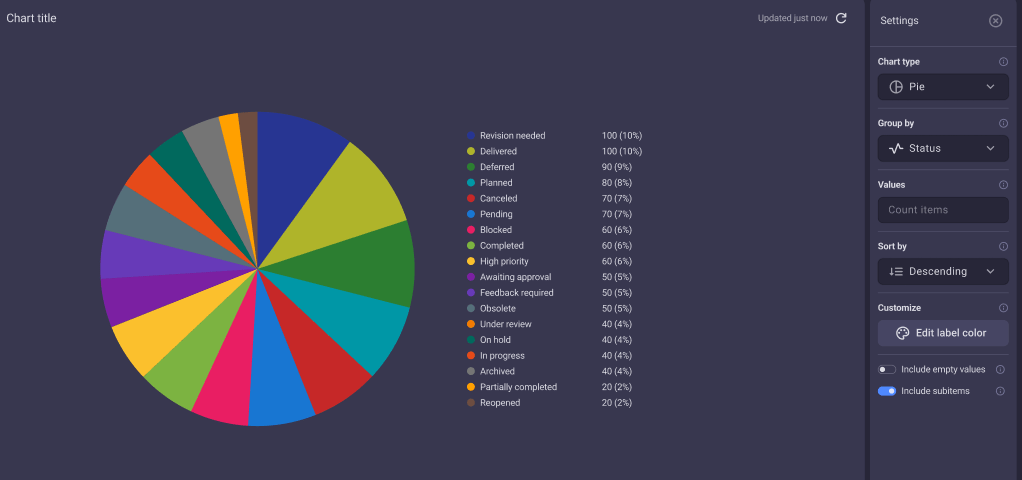
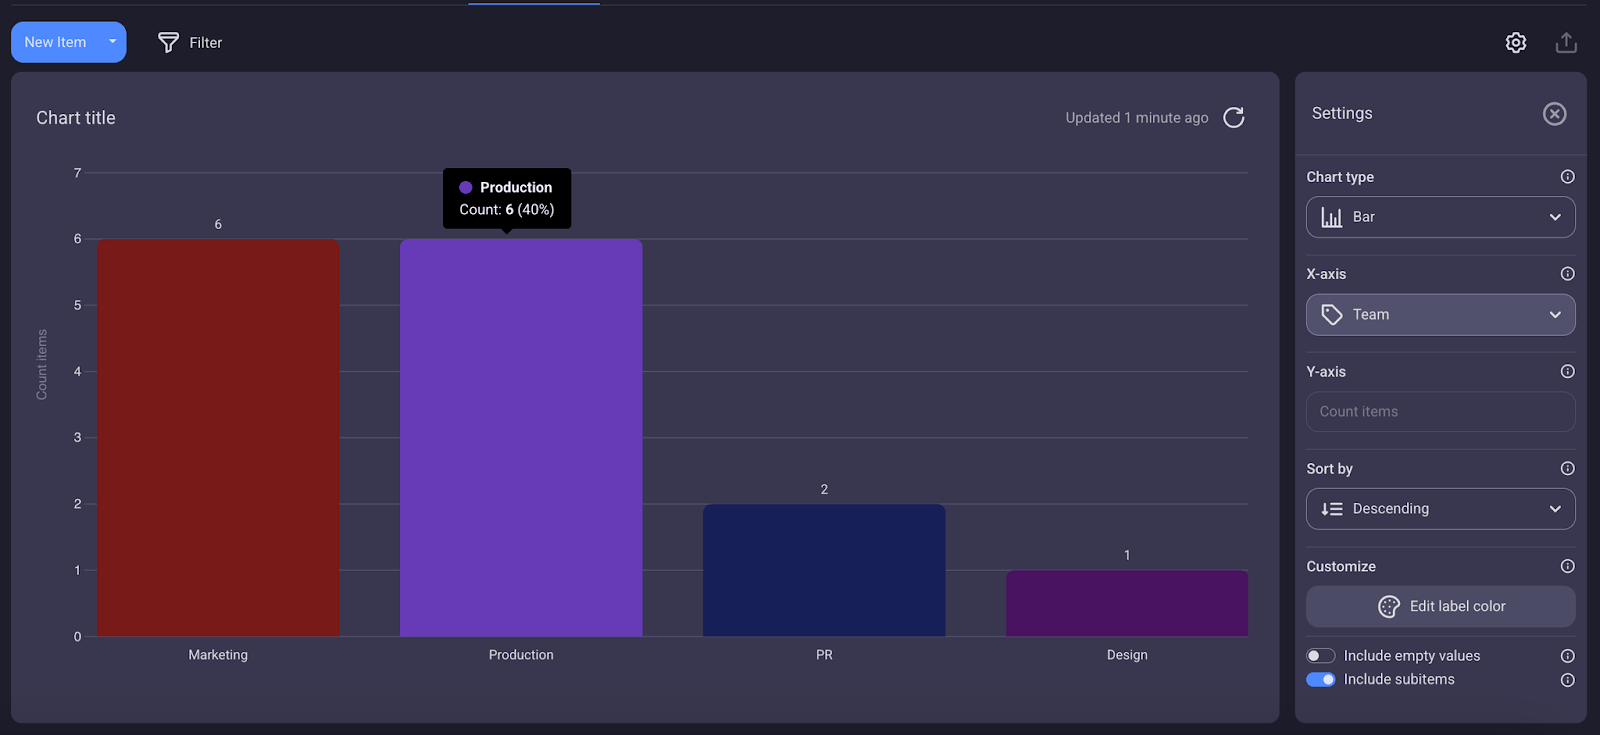
By default, you’ll get a Pie chart organized by Status, but you can use the sidebar on the right to quickly and easily change the chart type or what it’s grouped by. You can even change colors on the fly, in addition to all the granular filters and toggles we’ve already covered.
Who can use Chart view?
Chart view is available to all Plaky users — including free users — but how much you can tinker with the charts depends on your user permission:
- Board owners and board members with editing permissions can create and customize both private and public charts.
- Board members without editing permissions and those who can only add comments and files can only create private charts.
- Viewers cannot create or customize any charts.
So whether you’re a new user or a Plaky veteran — a free user or a paying customer — you can start using Chart view today, to increase productivity and use data for reports or decision-making.
Chart view is just one of the many exciting features our team has been working on. Stay tuned for future updates that will take your productivity to the next level!
Try Chart view today and get a better understanding of your projects. Sign up for Plaky for free!